Logging with LogDNA
LogDNA is now deprecated please use IBM Cloud Logs instead
Cloudant is now rolling out customer-facing logging for its Cloudant services. In this post we’ll explore how to set it up and how it can help you keep tabs on your Cloudant service.

Photo by Pär Pärsson on Unsplash
Setting up logging🔗
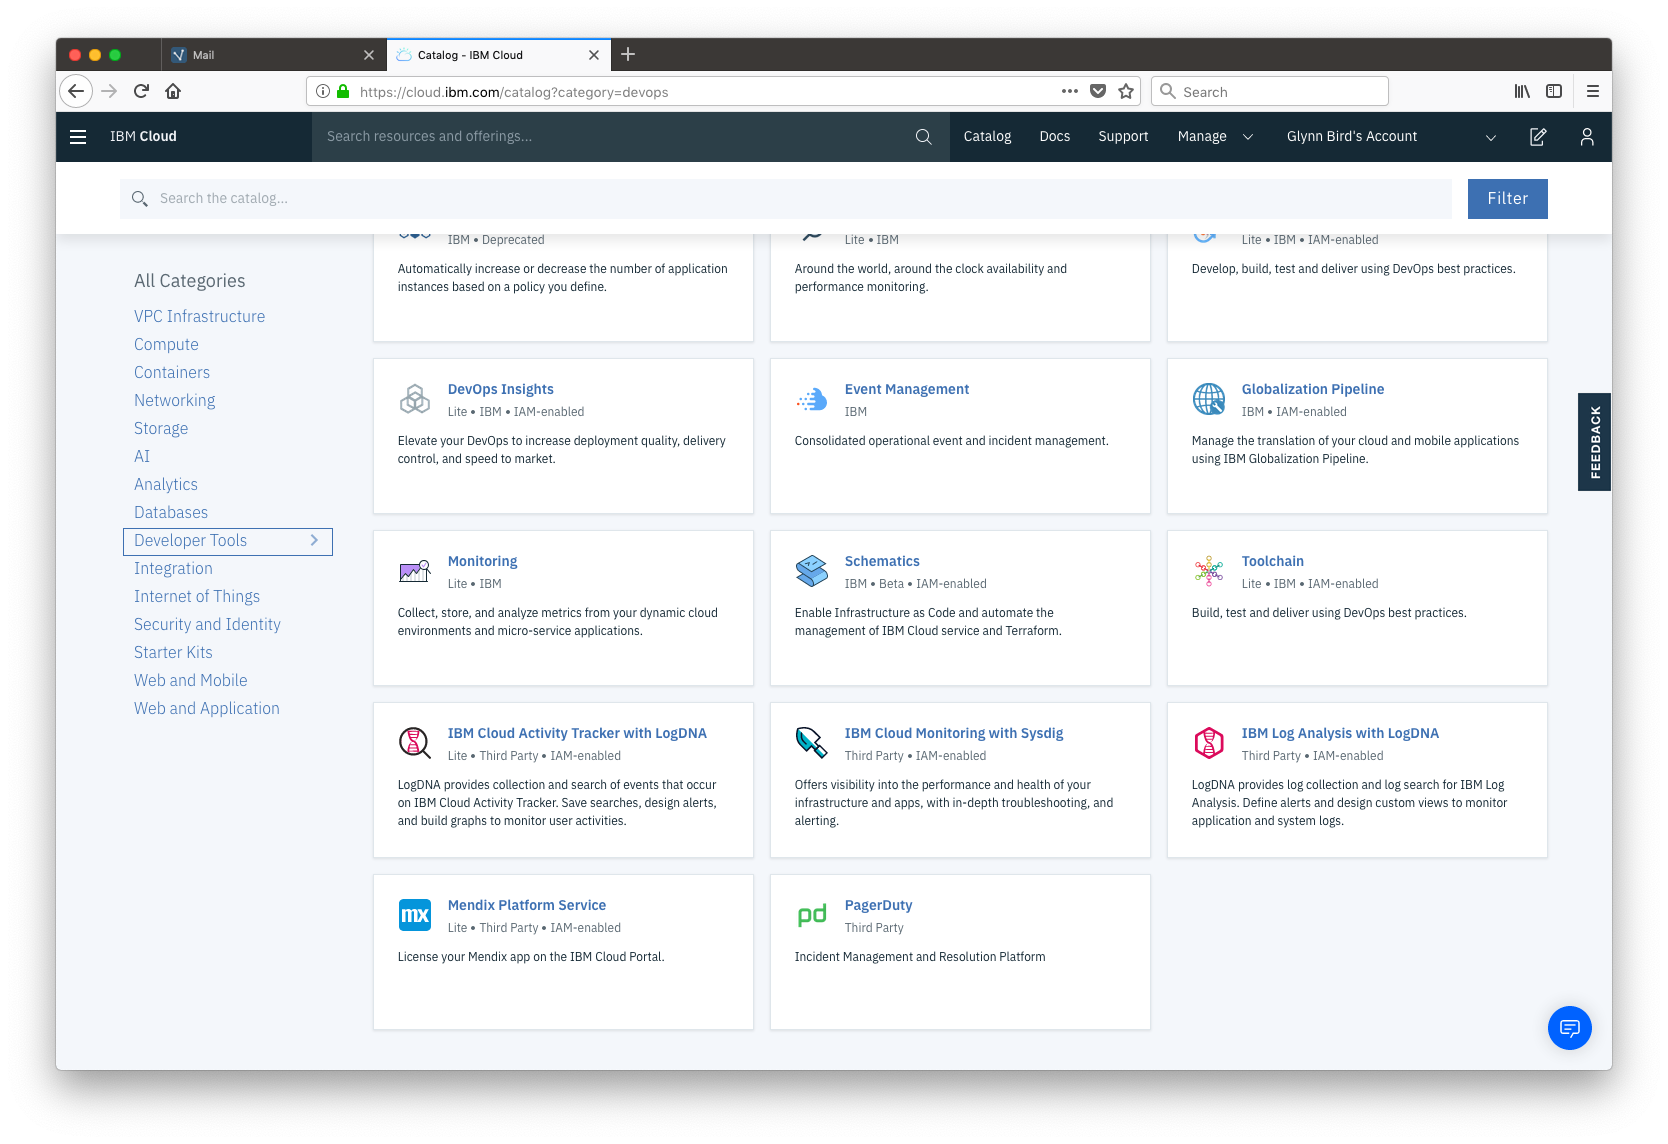
Firstly we need to setup an IBM Log Analysis with LogDNA service in the IBM Cloud - choose the service from the Developer Tools section of the catalog:
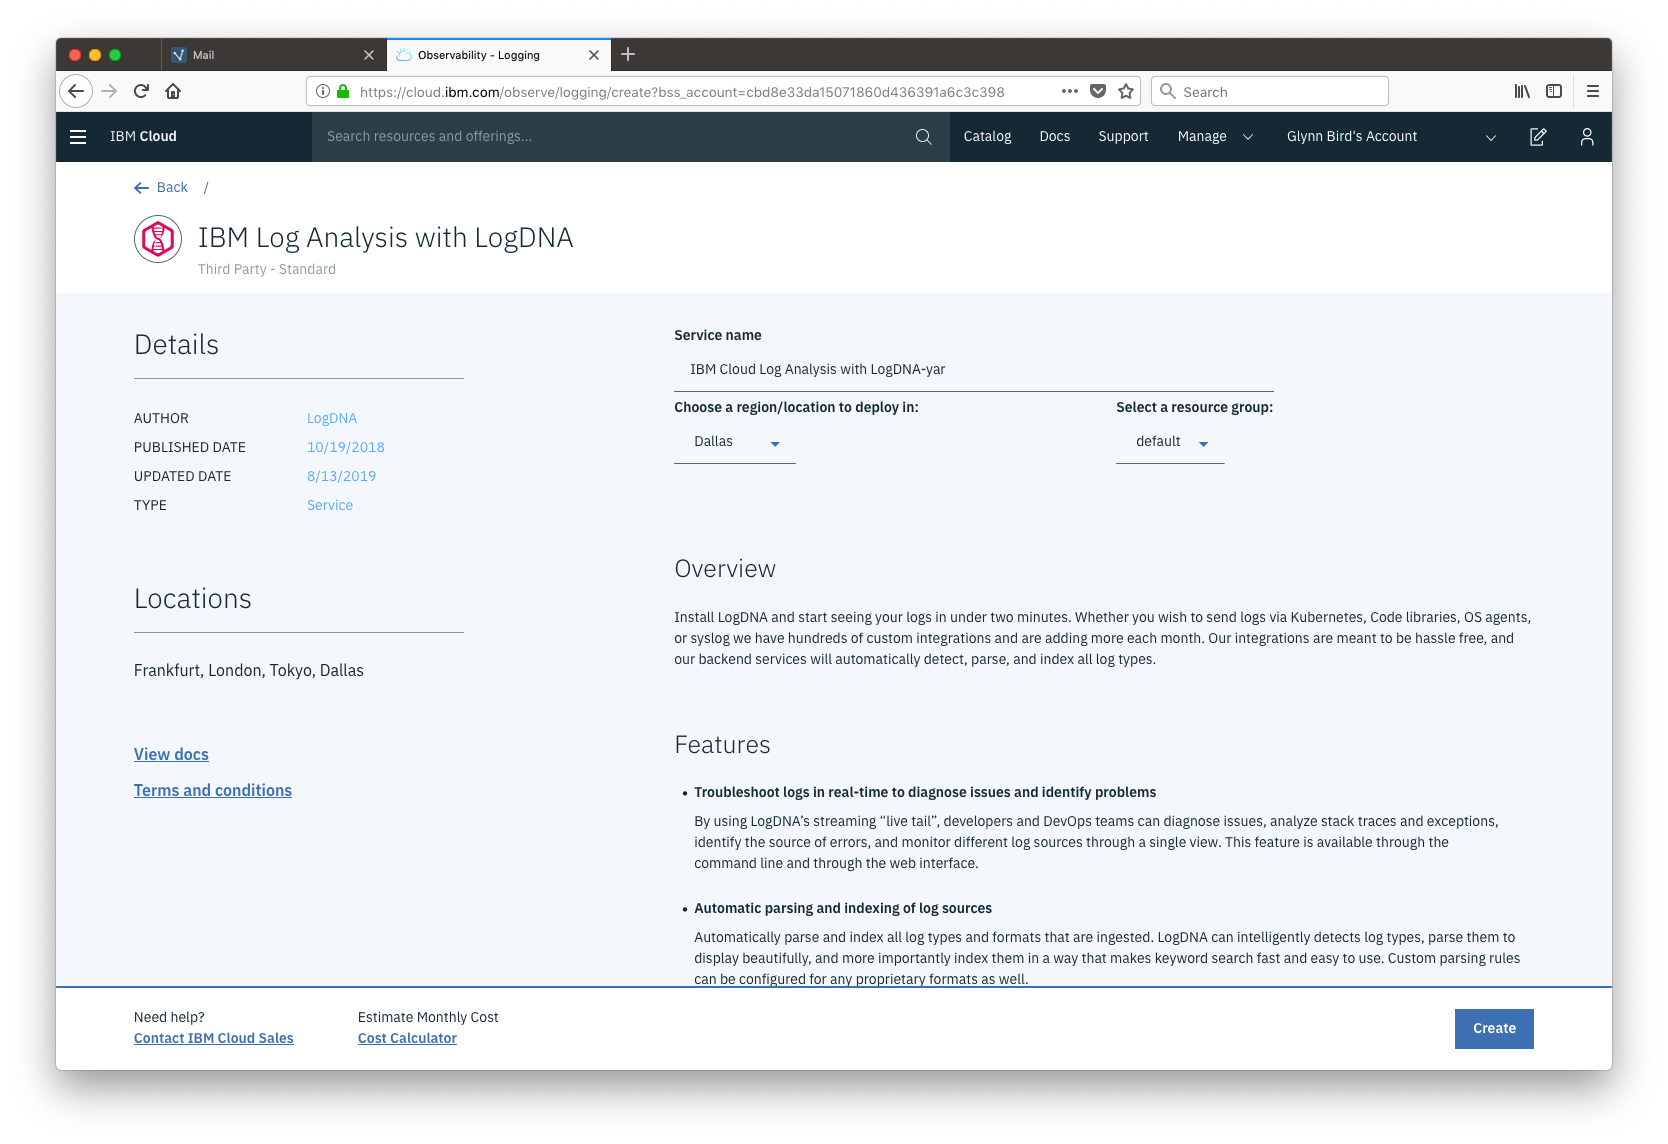
Configure the service in the same region as your Cloudant service (e.g. Dallas) and choose and appropriate resource group:
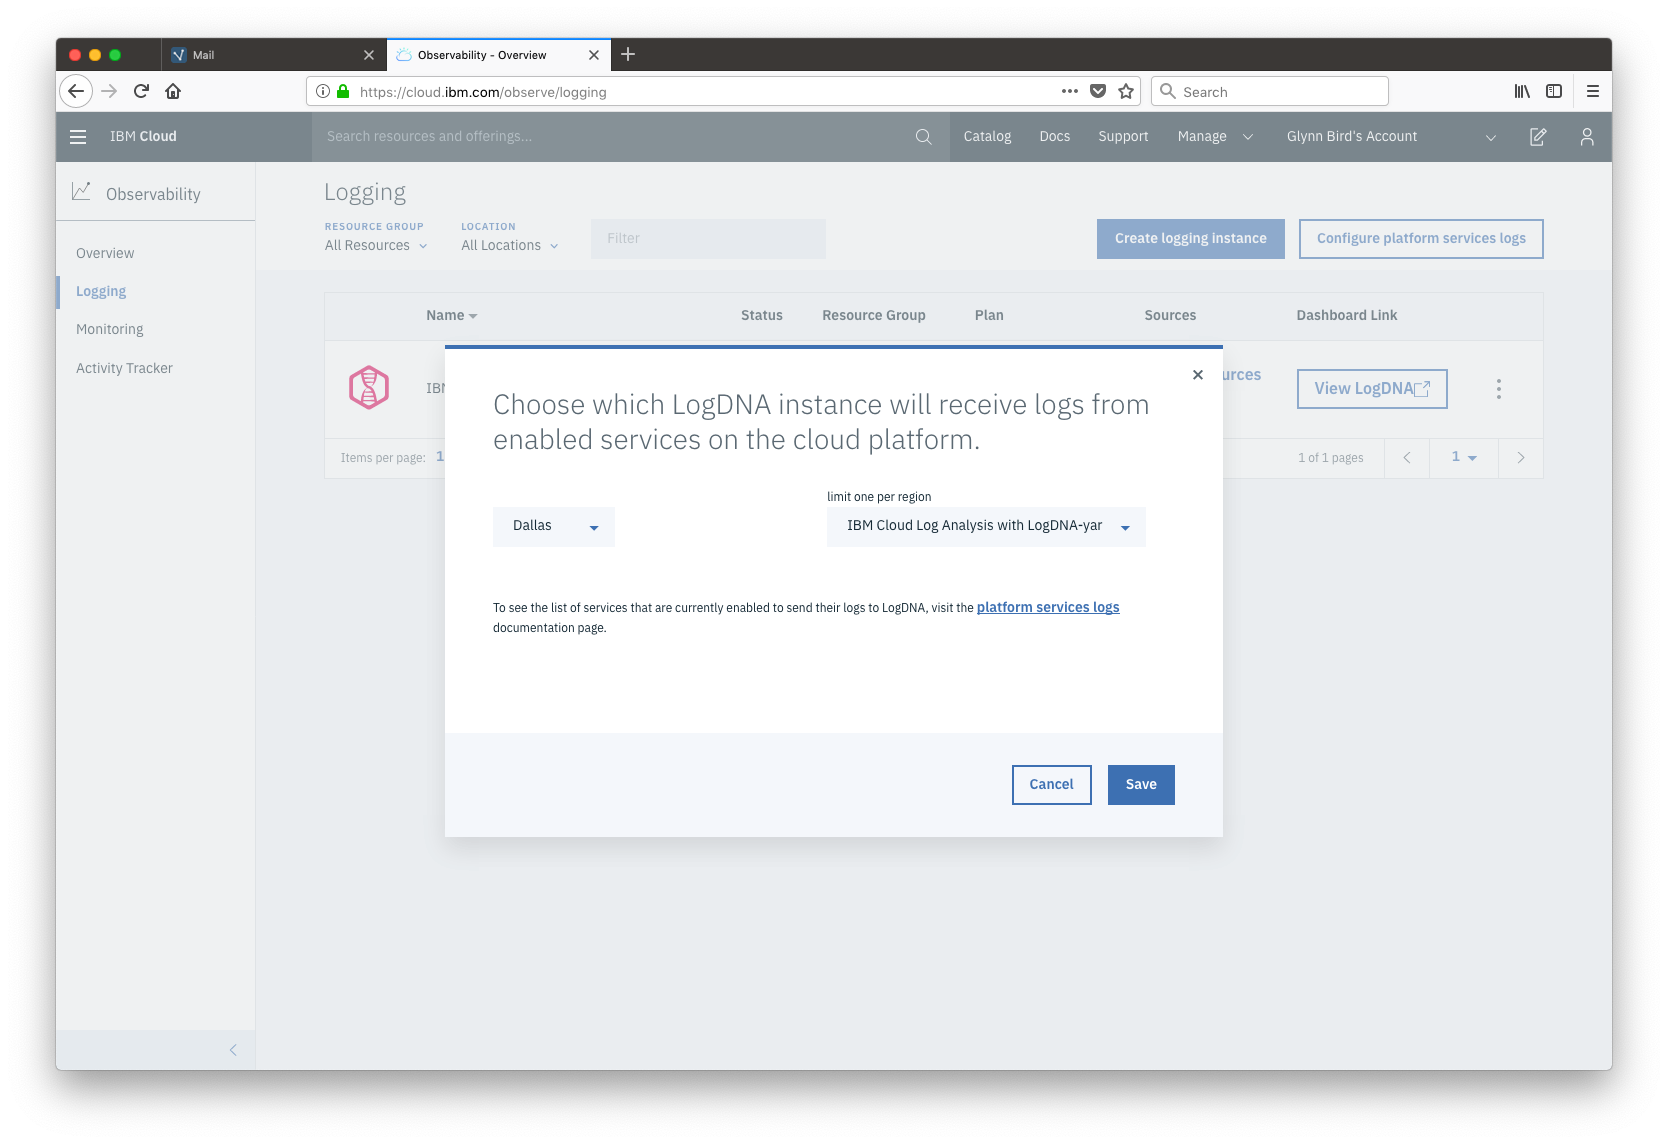
Once provisioned, choose the “Configure Platform Services” button to direct your IBM Cloud platform logs to your LogDNA service:
That’s it! Click the View LogDNA button to see a live stream of your logs:
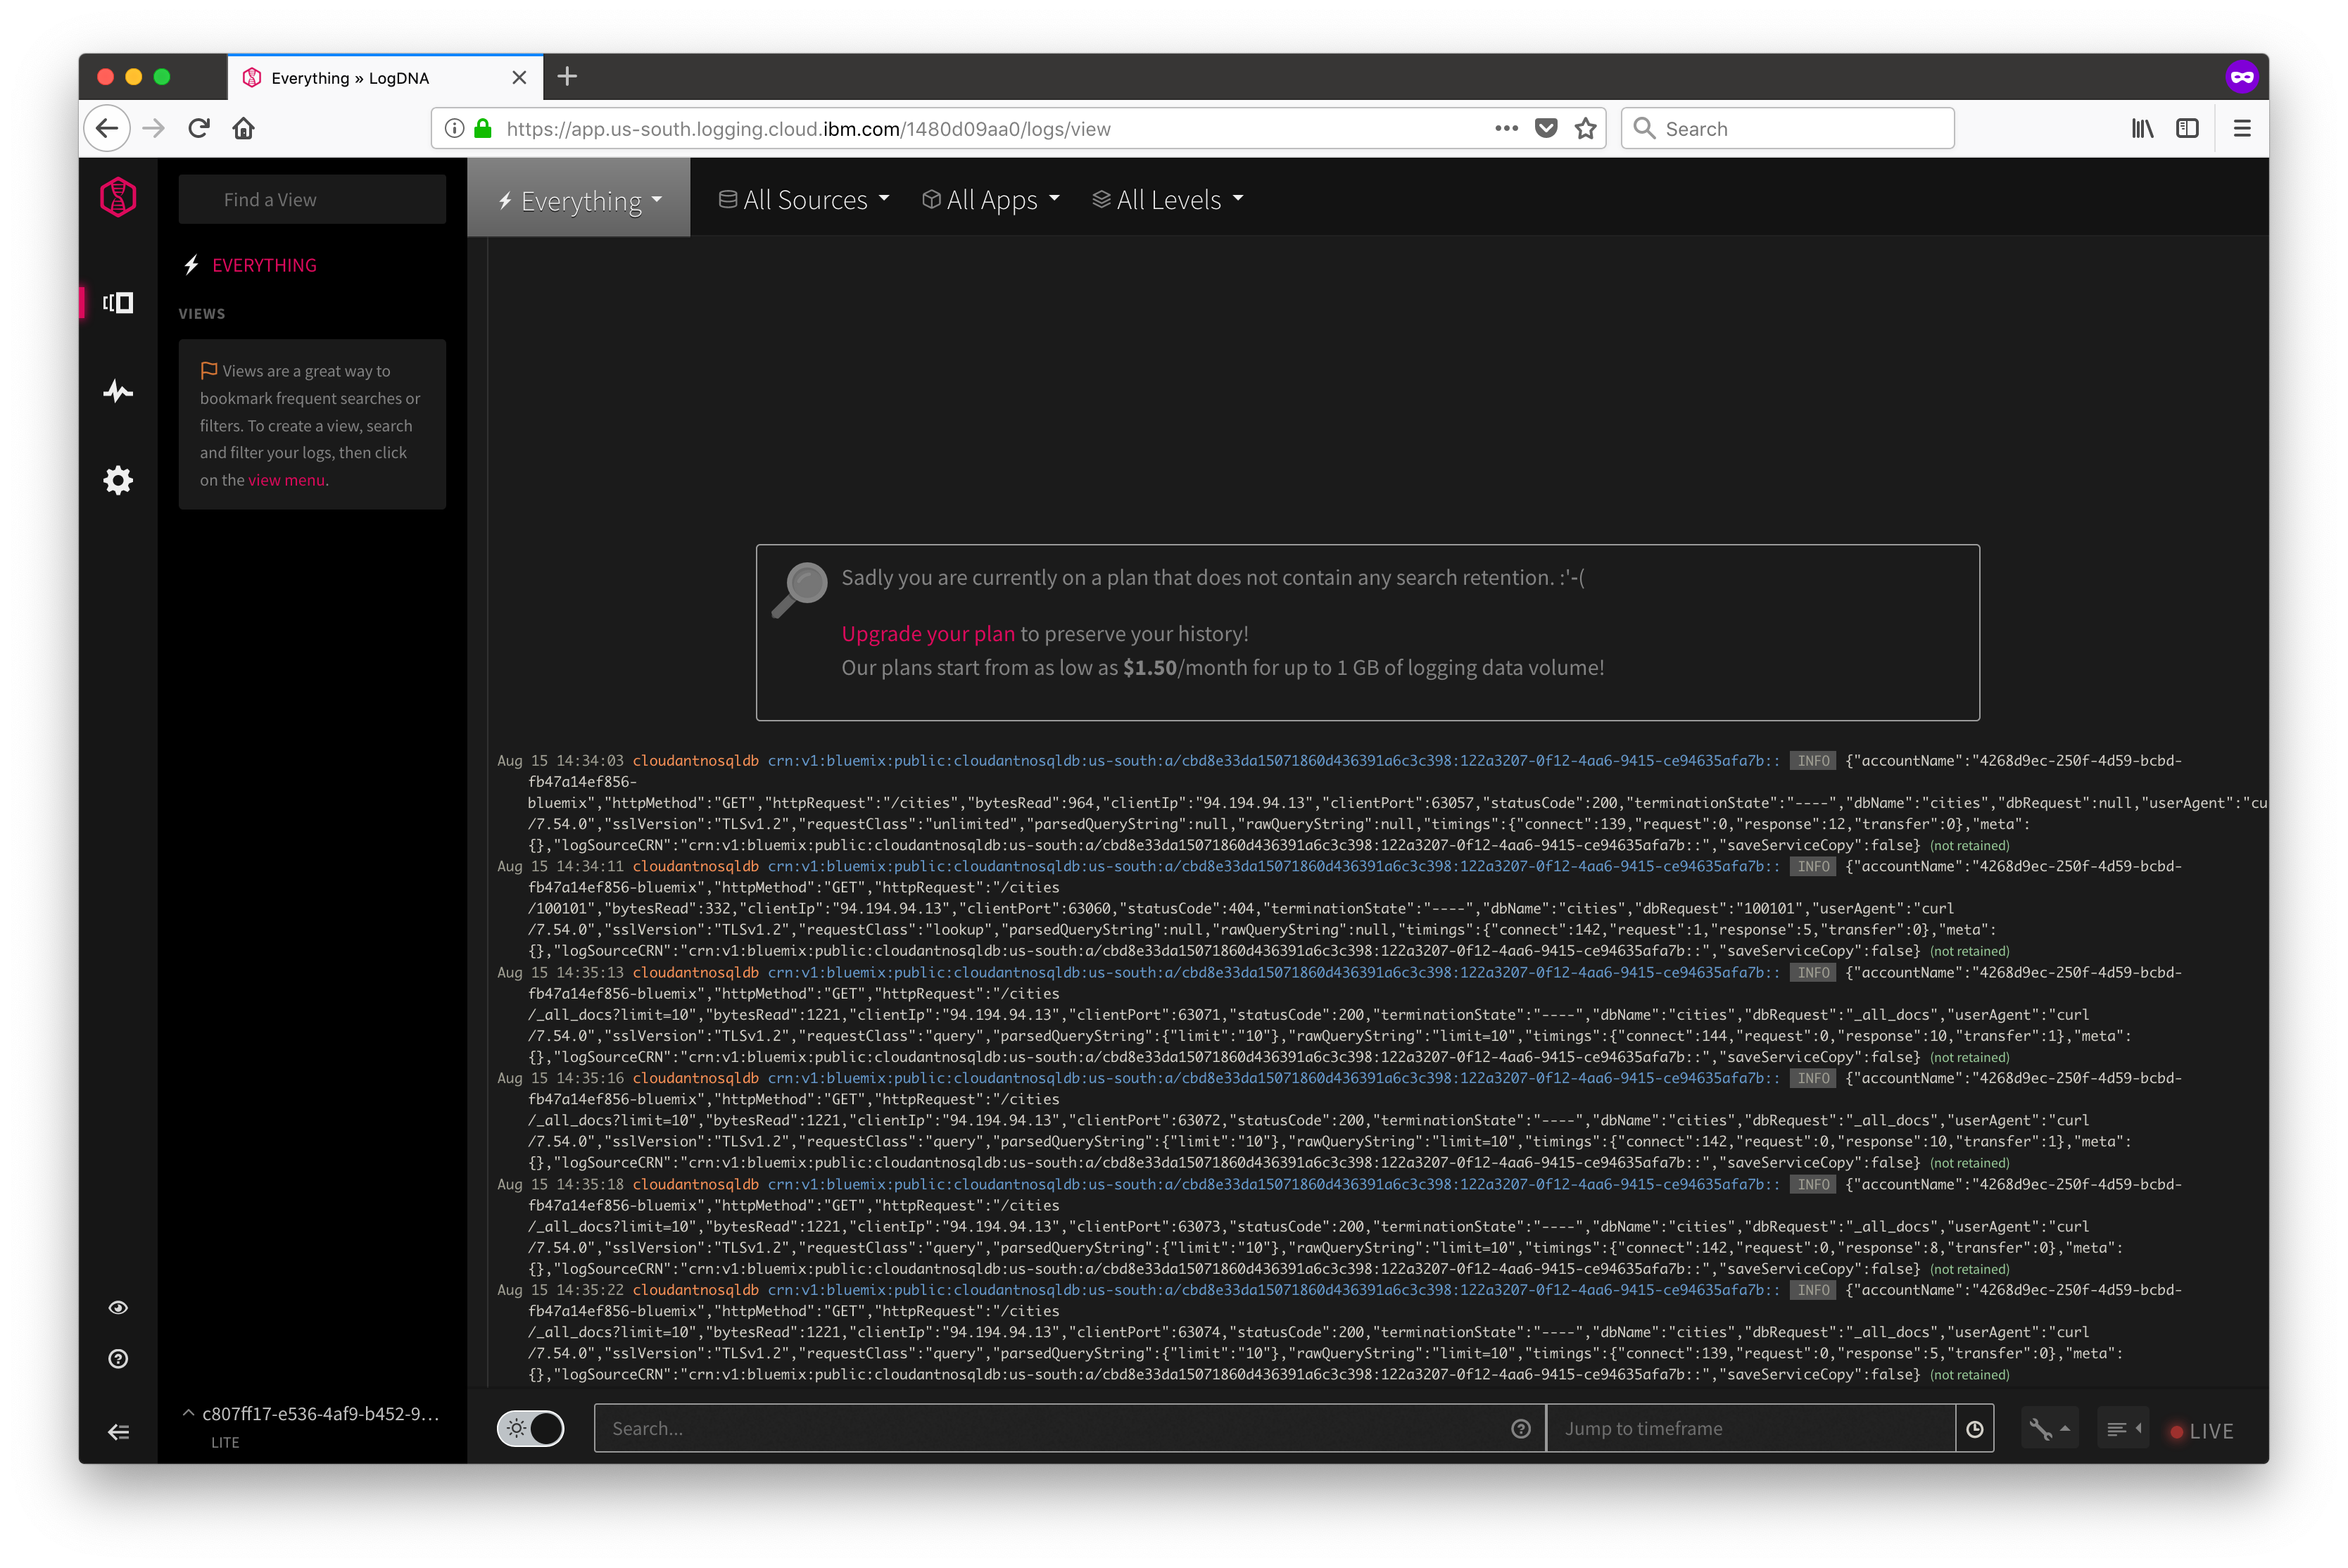
You should see all of your API calls listed in the live stream, with a short delay as the data makes its way to LogDNA,
Logging data structure🔗
The data is logged as a JSON object containing everything you need to know about the request and how it was handled:
{
  "accountName": "mycloudantaccount",
  "httpMethod": "GET",
  "httpRequest": "/cities/_all_docs?limit=10",
  "responseSizeBytes": 1221,
  "clientIp": "94.194.94.13",
  "clientPort": 63072,
  "statusCode": 200,
  "terminationState": "----",
  "dbName": "cities",
  "dbRequest": "_all_docs",
  "userAgent": "curl/7.54.0",
  "sslVersion": "TLSv1.2",
  "requestClass": "query",
  "parsedQueryString": {
    "limit": "10"
  },
  "rawQueryString": "limit=10",
  "timings": {
    "connect": 142,
    "request": 0,
    "response": 10,
    "transfer": 1
  },
  "meta": {},
  "logSourceCRN": "crn:v1:bluemix:public:cloudantnosqldb:us-south:a/someid::",
  "saveServiceCopy": false
}
In the free version of LogDNA, only the live stream of data can be viewed, with optional filtering by source. In the paid plans, the JSON data is parsed and is retained for a period of time, with optional archiving on IBM Cloud Object Storage.
With the data parsed, it’s easy to compose queries, alerts and graphs based on the data you see in the object above. You may wish to keep an eye on
- the response timing of query requests on a particular database.
- the count of the occurrence of HTTP 429 responses, indicated you have exceed your provisioned throughput.
- the range of IP addresses that are accessing your Cloudant service.
- the number of requests hitting each of your databases.
- the version TLS being used by your client code to access client. Do you have traffic originating from an out-of-date source?
- values of
bytesReadthat are very high. Do some of your requests return lots of data?
The LogDNA documentation shows how you can explore the incoming stream of data, creating named views which can be retrieved later. Saved views can be combined to create visual dashboards to give you an at-a-glance view of your Cloudant traffic.
Example graphs🔗
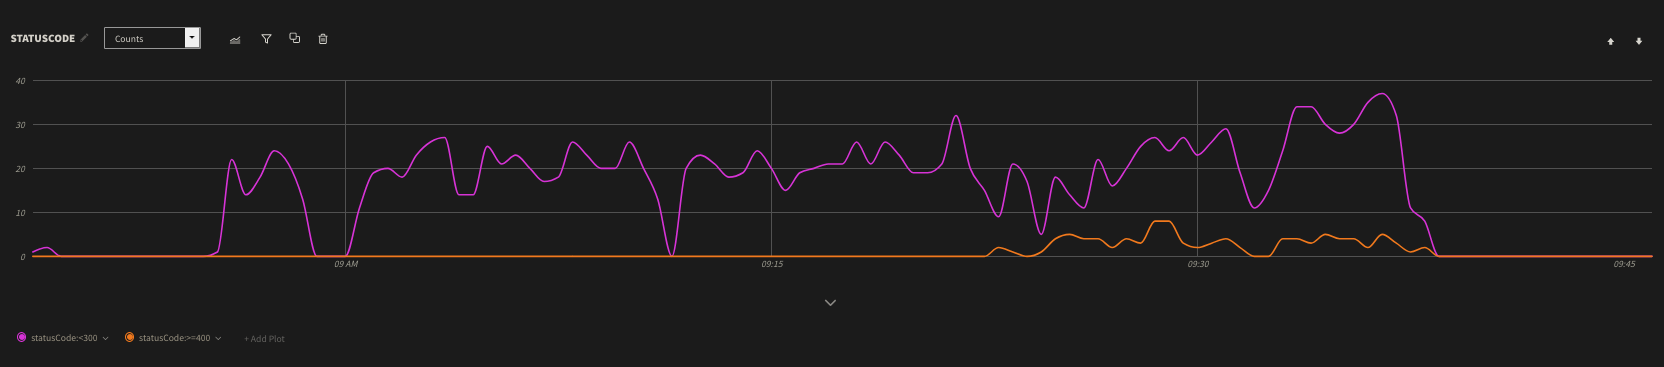
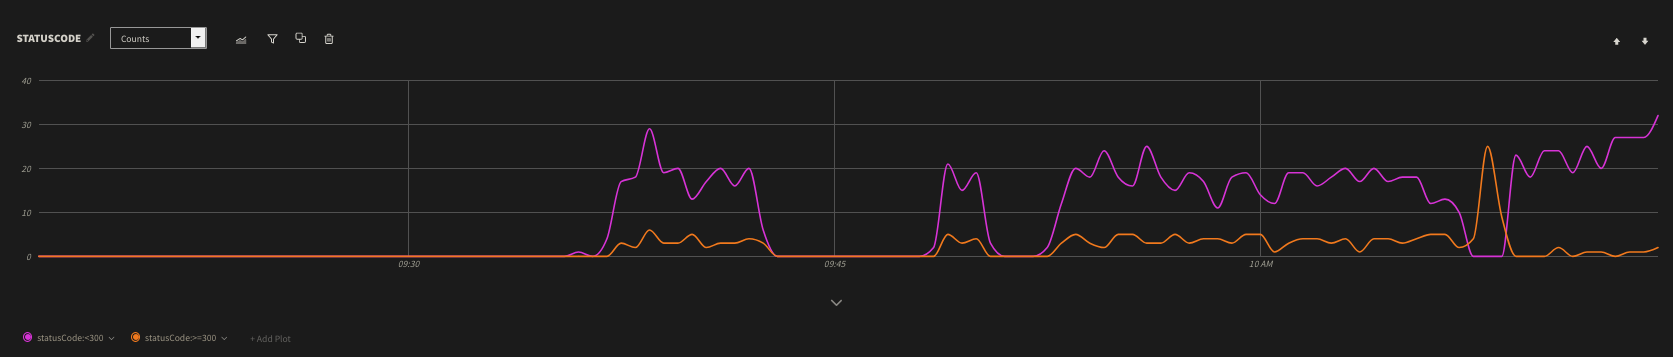
Request counts by HTTP request code, grouped into successes (statusCode < 300) and failures (statusCode >= 400):
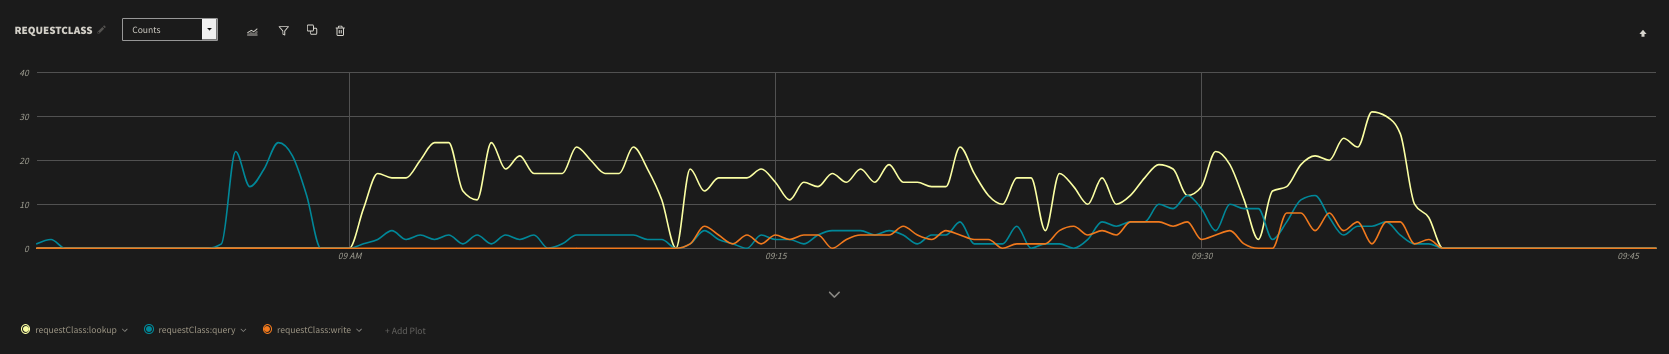
Request counts by request “class” i.e. whether IBM considers the request a read, write or query for billing purposes:
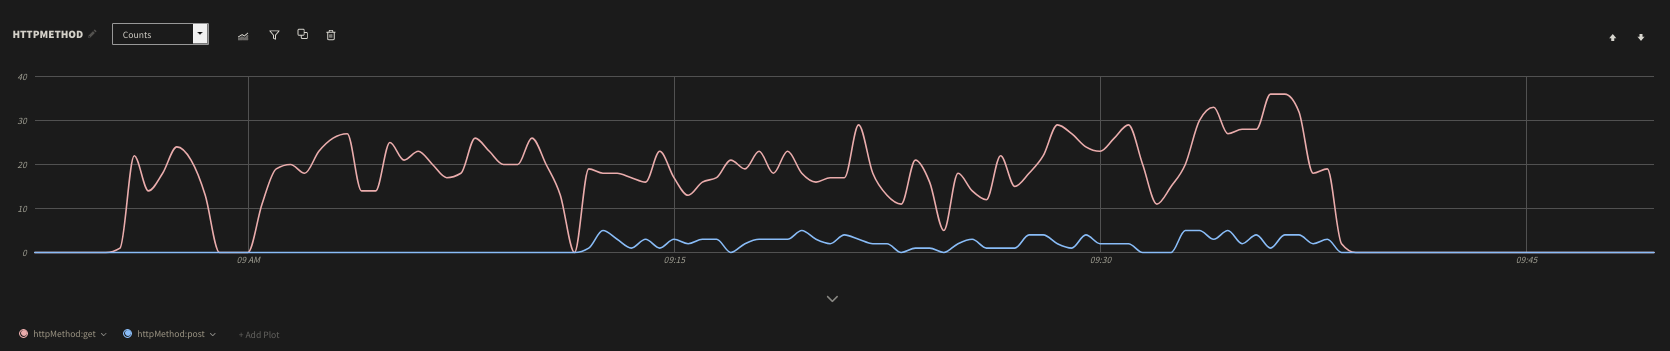
Request counts by HTTP method (get or post in this case):
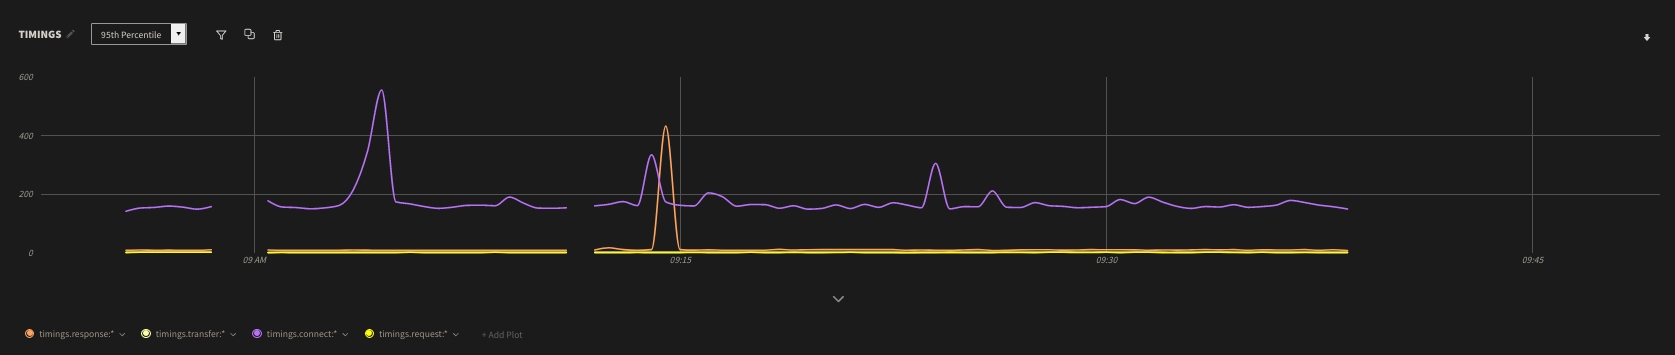
95th percentile response times broken out by each of the timing metrics:
Creating a graph - step by step🔗
Log into your Log Analysis with LogDNA service, choose “Boards” from the left-hand menu and click “New Board”:

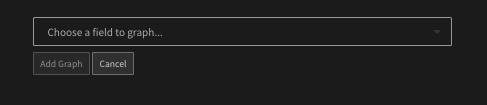
Then click “Add Graph”:

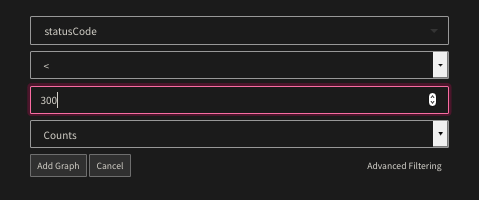
LogDNA then needs to know which field in the JSON you wish to plot:
Enter statusCode, the < operator and 300. This will only show status codes of 299 and below, indicating success:
You should now see a plot of the counts of successful API calls against time. To add a second plot, click “Add Plot”:
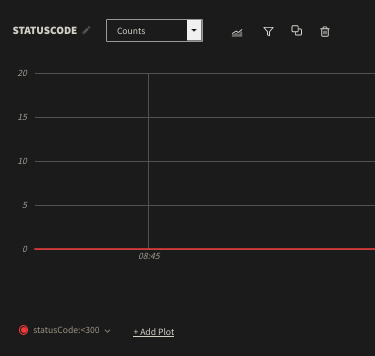
This time choose statusCode >= 300 to plot the errors.

The graph will change to add a second plot showing the error counts alongside the success counts.
Repeat this process to add further graphs on metrics that interest you.
Timing metrics🔗
The logged JSON contains an object with the timings of each part of the request:
"timings": {
  "connect": 142,
  "request": 0,
  "response": 10,
  "transfer": 1
}
connect- the time it took for your HTTP client to make the initial HTTPS connection (the handshakes required to negotiate a secure connection between client and server). Programmatic API calls using the official Cloudant libraries will re-use existing connections, eliminating this connection delay.request- the time taken to receive the request data. For bulk uploads, this may be significant, especially from clients with limited uplink bandwidth.response- the time taken for the database to do its work.transfer- the time taken for the response to be transferred to the client.