Tracking cryptocurrencies
Tracking your cryptocurrency portfolio with serverless functions & Cloudant🔗
Monitor the value of your bitcoin hoard with serverless Cloud Functions writing data to Cloudant
The value of crypto-currencies can vary greatly over time. If you’re lucky, some coins bought for a handful of dollars a few years ago can be worth thousands of dollars now.
There are many websites and apps that can help you monitor your portfolio, but what’s the fun in using a ready-made solution when you can build your own?!
Crypto pricing API🔗
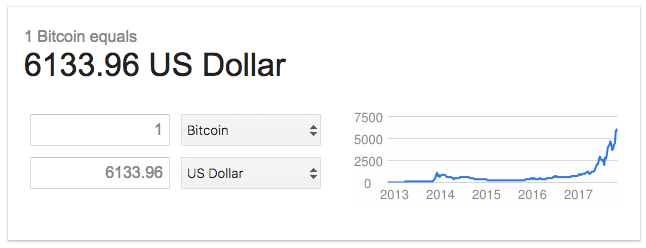
We can use an API from CryptoCompare to get the latest price of Bitcoin and Ether, two popular coins, in US dollars. We can call the API passing the symbols BTC, ETH and USD as parameters. For example:
curl 'https://min-api.cryptocompare.com/data/pricemulti?fsyms=BTC,ETH&tsyms=USD'
{
  "BTC": {
    "USD": 6166.19
  },
  "ETH": {
    "USD": 308.09
  }
}
For a single currency, we can use an even simpler call:
curl 'https://min-api.cryptocompare.com/data/price?fsym=BTC&tsyms=USD'
{
  "USD": 6165.54
}
Retrieving the data every minute🔗
We can write a script to fetch this data every minute, writing a document to a Cloudant database each time.
The Node.js script to do this is very simple:
const cloudant = require('cloudant');
const request = require('request');

const readBitcoinPrice = function () {
  return new Promise(function(resolve, reject) {
    var req = {
      url: 'https://min-api.cryptocompare.com/data/pricemulti?fsyms=BTC&tsyms=USD',
      json: true
    };
    request(req, function (err,r,data) {
      if (err) {
        return reject(err);
      }
      resolve(data);
    });
  });
};

const main = function(args) {
  return readBitcoinPrice().then(function(data) {
    console.log(data);
    var obj = {
      _id: new Date().getTime().toString(),
      btcinusd: data.BTC.USD
    };
    if (args && args.url) {
      const c = cloudant({url: args.url, plugin: 'promises'});
      const db = c.db.use('bitcoin');
      return db.insert(obj);
    } else {
      return { ok: true }
    }

  })
};

exports.main = main;
The main function expects the Cloudant URL to be supplied as the url key in its args parameter. It calls the API and creates a JSON document which is written to Cloudant:
{
  "_id": "1509444081742",
  "btcinusd": 6165.54
}
The _id is the unique key for each Cloudant document. Here, it is actually a timestamp (the number of milliseconds since 1970) which will be unique and in time order for our “once per minute” polling of the API.
All we need now is to call the “main” function every minute.
Going serverless🔗
We have a number of options here:
- We could write a Node.js script that is on 24/7 and use a JavaScript
setIntervaltimer to call themainfunction every 60000 milliseconds. - We leave the script doing a single execution as it does now and call it every minute using cron — a task scheduler found on most Unix-like systems.
- We could push our script to IBM Cloud Functions, IBM’s serverless platform, and instruct it to run it for us every minute.
We put the URL of our Cloudant service in the environment variable CLOUDANT_URL and run a series of commands to deploy our Node.js file to IBM Cloud Functions:
# deploy to OpenWhisk
wsk package update blockchain --param url "$CLOUDANT_URL"
wsk action update blockchain/bitcoin bitcoin.js

# run every minute
wsk trigger create every-minute --feed /whisk.system/alarms/alarm --param cron "* * * * *"
wsk rule update every-minute-rule every-minute blockchain/bitcoin
wsk rule enable every-minute-rule
The first two commands deploy the code, the last three trigger the code to be run every minute using the alarm package.
Once deployed, we should see the documents appearing in our Cloudant bitcoin database:
{
  "_id": "1509448502820",
  "_rev": "1-e96f50965801b81f2cf19fc2d2ad637b",
  "btcinusd": 6200.42
}
Querying the data🔗
Once we’ve left our data collection script running for a while, we can query the data using Cloudant’s API. Our data is already sorted in time order because we used a timestamp as the key _id field.
We can therefore get the first 2 hours of data:
curl "$CLOUDANT_URL/bitcoin/_all_docs?limit=120"
The most recent hour of data:
curl "$CLOUDANT_URL/bitcoin/_all_docs?limit=60&descending=true"
The most recent data point:
curl "$CLOUDANT_URL/bitcoin/_all_docs?limit=1&descending=true"
Aggregating the data🔗
Cloudant’s MapReduce system allows custom indexes to be created by supplying a JavaScript function which is executed over each document in a database.
We can use a function like this:
function (doc) {
  var ts = parseInt(doc._id);
  var date = new Date(ts);
  var y = date.getUTCFullYear();
  var m = date.getUTCMonth() + 1;
  var d = date.getUTCDate();
  var h = date.getUTCHours();
  var min = date.getUTCMinutes();
  emit([y, m, d, h, min], doc.btcinusd);
}
Here’s what it does:
- turn the
_idfield into an integer - parse it into a JavaScript Date object
- extract the year, month, day, hour, and minute
emita key/value pair where the key is the array[year, month, day, hour, minute]and the value is the bitcoin price
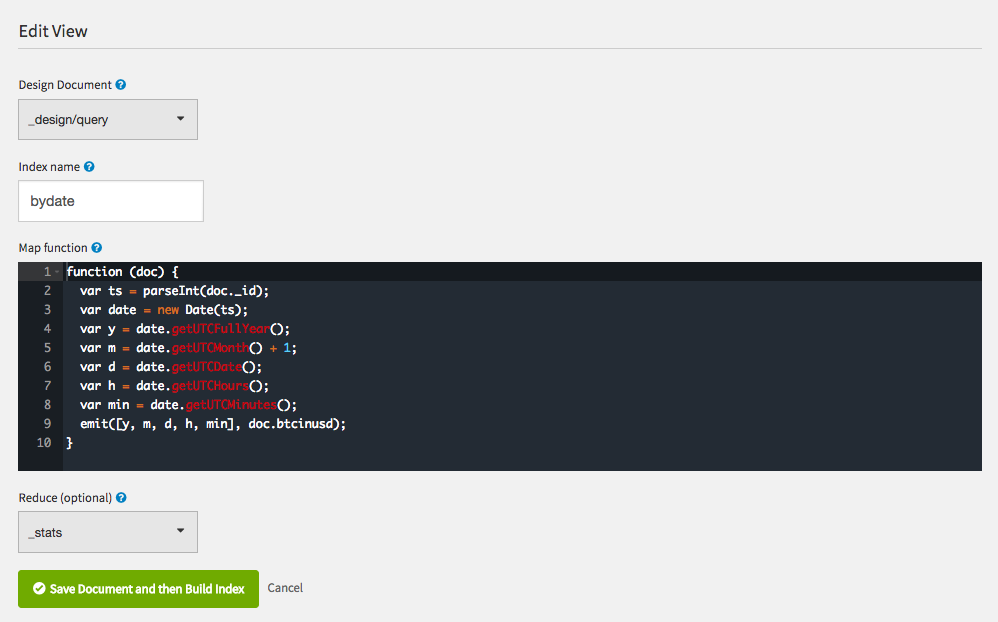
Combined with the built-in _stats reducer, we can use this index to create hierarchical aggregations of the bitcoin price:
curl "$CLOUDANT_URL/bitcoin/_design/query/_view/bydate?group_level=2"
{
  "rows": [{
      "key": [2017, 8],
      "value": {
        "sum": 88808847.69999999,
        "count": 20770,
        "min": 3613.28,
        "max": 4764.44,
        "sumsqr": 380636509418.7472
      }
    },
    {
      "key": [2017, 9],
      "value": {
        "sum": 175506096.85000002,
        "count": 42849,
        "min": 2982.94,
        "max": 4974.69,
        "sumsqr": 724630560624.3647
      }
    },
    {
      "key": [2017, 10],
      "value": {
        "sum": 233471117.30000004,
        "count": 44238,
        "min": 4143.9,
        "max": 6294.59,
        "sumsqr": 1251129781142.4658
      }
    }
  ]
}
The above query asks for all of the data grouped by year and month. Notice how the _stats reducer gives us a sum/count/sumsqr (which we can use to calculate mean, variance, and standard deviation) and the maximum and minmum value per month. The group_level parameter indicates how many levels into the key we wish to aggregate. For example:
group_level=1- yeargroup_level=2- year/monthgroup_level=3- year/month/daygroup_level=4- year/month/day/hour
We can also specify a startkey and endkey to limit range of data we want to report on:
curl "$CLOUDANT_URL/bitcoin/_design/query/_view/bydate?group_level=3&startkey=[2017,10,1]&endkey=[2017,11,1]"
The above command asks for year/month/day data for the month of October 2017.
What’s next?🔗
We could do more than just record the data. We could calculate technical indicators and use them to predict whether the market is heading upwards or downwards. We could send emails or alerts when certain market conidtions prevail. We could write an algorithm that decides when it’s a good time to buy or sell and call a third-party API to actually make crypto-currency trades.
I’m not that brave, so I wrote a trading simulator that allows you to simulate crypto-currency trading using the last 2 hours of bitcoin data. You start with $5000 of cash and $5000 of bitcoin. Trade as many times as you like and see if you end up with more than $10000 at the end of the game.
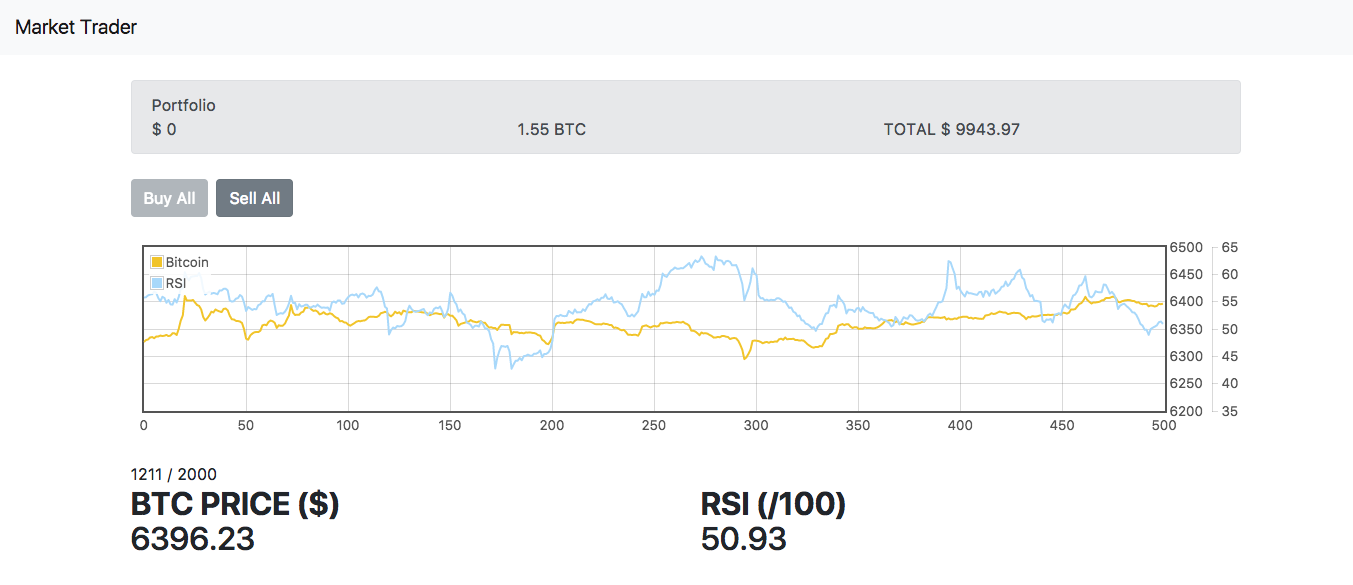
Try it for yourself: https://glynnbird.github.io/markettrader/public/index.html